Radio Monitoring
Influence of CMEs on the Ionosphere
Worldwide distributed ionosonds provide daily information about critical frequency of the ionosphere. Space agencies publish up-to-date information about space weather on the Internet:
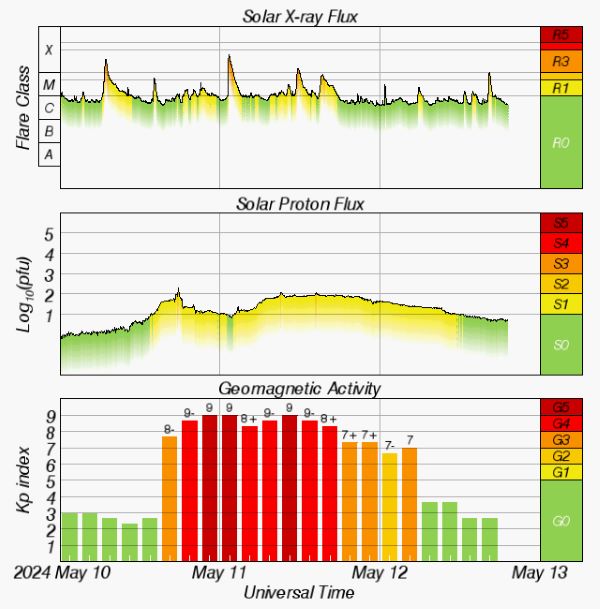
Graph of space weather conditions on May 2024 showing an extreme geomagnetic storm. Courtesy of the Space Weather Prediction Center.
So why carry out propagation studies when everything is within reach?
The question to be investigated here was what statements can be made with amateur means about the changes in the state of the ionosphere when the Earth is hit by a coronal mass ejection (CME). Such an event can lead to a coupling of solar plasma from the coronal mass ejection into the terrestrial magnetosphere, which not only triggers a disturbance of the terrestrial magnetic field (geomagnetic storm), but also significantly reduces the electron density in the F2 layer. From the observation of a reduced reflection height of VLF waves at the D-layer, an increase in electron density at 70-80 km altitude can also be deduced. These ionospheric effects are referred to as ionospheric storms. The ionospheric disturbances persist for several days after the geomagnetic activity has normalized.
Amateur radio beacon transmissions are to be used to investigate the state of the ionosphere in this study. The WSPR beacon protocol developed by Joe Taylor has been adopted for this purpose. In order to obtain sound results from the reception reports of worldwide radio stations, meaningful parameters and an evaluation method must be found. The question of which amateur radio band is best suited for such investigations also needs to be clarified.
In case of a single ionospheric reflection, the distance between a TX- and a RX station defines the angle of incidence of the radio waves on the D and F2 layers. Thereby, the angle of incidence determines the extent of attenuation in the D layer (the flatter the angle of incidence, the longer the path through the absorbing D layer) and diffraction in the F2 layer (the steeper the angle of incidence, the higher the ionization required for reflection). The electron densities in both layers therefore control the distances within which radio contact can be established. Hence, TX-RX distance appears to be a suitable measurement parameter for the state of the ionosphere. If the distances of all RX stations to the TX location are plotted as a function of time and a density map is created using a suitable statistical method, this should provide an accurate picture of the ionospheric state prevailing at any given time.
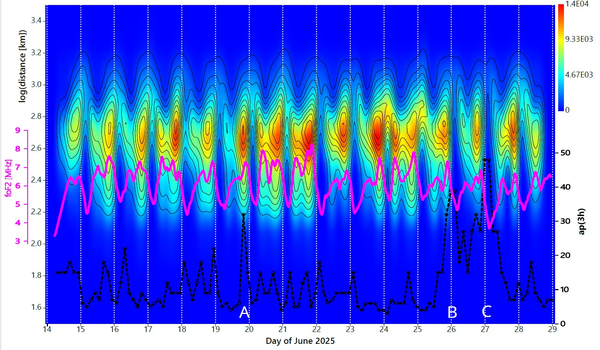
Density map of the logarithmised TX-RX distances as a function of time (UTC). The critical frequency of the F2 region, foF2, is shown in purple. It is taken from the ionosonde in Dourbes, Belgium. The curve of the three-hour ap index, ap(3h), is dashed and shown in black. It is takne from the GFZ Helmholtz-Zentrum für Geoforschung, Germany. Three weaker increases in the ap(3h) index are marked with the letters “A-C”. Local time is UTC+ 1h.
The above figure shows a recurring distribution pattern depending on the time of day in June 2025. It was the result of the interaction of the daily variation of the electron density of the D and F2 layer in combination with the geographical distribution of the RX stations. Let us first look at the daily course of the upper contour in Fig. 2, which is characterized by the long-distance connections. We have the longest radio links at midnight, the distances then decrease until midday and then increase again. This curve is an absorption effect of the D region, as longer radio links with their flat angles of incidence of the radio waves experience greater attenuation during the day. The ionization of the F2 region is found to be always sufficient for successful reflection at the flat angles of incidence of the radio waves.
The course of the lower contour in the figure is determined by the short-range connections. Here we find the shortest radio connections during the day, which are then gradually lost at night in favour of ever longer distances. This is a direct effect of the electron density in the F2 region. If you look at the purple curve in Fig. 2, which shows the daily progression of FoF2, this correlation becomes clear: the higher the FoF2, the shorter radio distances are possible. The attenuation by the D region only plays an insignificant role due to the steep angle of incidence of the waves.
Now, we will focus on the impact of solar events on the ionosphere. In the above figure we find some smaller events, discernable by a steep rise of the ap-index (letters A-C). Event A occurred during the daily ionization maximum of the F2 region. The effect on the strongly ionized F2 region is only slight. The situation is different for the two events B and C, which occur during the daily ionization minimum. Here, the short and medium-range connections are completely lost, especially for event C. The effects on the already weakly ionized F2 region are clearly visible here.
Summarised, it could be shown, that transmitted WSPR-beacons in the 40 m band together with an appropriate analysis tool is capable of providing a finely resolved representation of ionospheric state changes that are in complete agreement with the results of ionosonde measurements. Not only the influence of F2-layer but also the effects of the D-region become visible.
A detailed description in German you can find in this article published by CQ DL, the magazine of the DARC, 09/2025, pp. 48-50. A more in-depth analysis is submitted to QEX, the magazine of the ARRL.
