Radio Monitoring
Diurnal LF-Propagation
For this study I chose five transmitters that are 24 h per day on air, supply a stable signal and transmit at different frequencies in the low frequency range, see table 1:
|
Transmitter |
Power |
Frequency |
Location |
Distance |
Direction |
|---|---|---|---|---|---|
|
DHO38 |
1.2 MW |
23.4 kHz |
53° 4’ 55’’ N |
185 km |
301° |
|
MSF |
50 kW |
60 kHz |
54° 55’ N |
923 km |
294° |
|
HBG |
25 kW |
75 kHz |
46° 24’ 30’’ N |
705 km |
204° |
|
DCF77 |
50 kW |
77.5 kHz |
50° 0’ 56’’ N |
259 km |
196° |
|
DCF39 |
50 kW |
139 kHz |
52° 17’ 10’’ N |
132 km |
88° |
|
Location of the receiver is Algermissen, northern Germany (52° 15’ 9’’ N 9° 58’ 43’’ E). |
|||||
Monitoring was performed for two days: 03.01.2011, 20:30 to 05.01.2011, 20:00 with antenna DX500 (RF-Systems). This results in two 24 h datasets. Time is given as local time. Sunrise was at 8:29 h and sunset at 16:20 h. Solar activity shows no significant irregularities during the monitoring period, see table 2 (data from www.solen.info/solar):
|
Date |
Solar sun spot number (NOAA) |
Solar flux (NOAA) |
Planetary A-index |
|---|---|---|---|
|
03.01.2011 |
51 |
92.1 |
4 |
|
04.01.2011 |
54 |
90.6 |
4 |
|
05.01.2011 |
50 |
87.7 |
2 |
The software AR5000RA was used to set the five vfos A - E of the AR5000 receiver according to table 3 (see below). The feature “Monitor” > “Observe up to five distinct frequencies” was chosen to perform the monitoring.
|
VFO |
Frequency |
Mode |
IF-Bandwidth |
AGC |
HF-Attenuation |
|---|---|---|---|---|---|
|
A |
60 kHz |
CW |
3 kHz |
slow |
0 dB |
|
B |
74.5 kHz |
CW |
3 kHz |
slow |
0 dB |
|
C |
77,5 kHz |
CW |
3 kHz |
slow |
0 dB |
|
D |
139 kHz |
CW |
3 kHz |
slow |
0 dB |
|
E |
23.4 kHz |
CW |
3 kHz |
slow |
0 dB |
|
Integration time: 2s, Sampling rate: 20s |
|||||
For each moment the mean is calculated from the two 24h-datasets of recorded signals from the transmitters DHO38 (magenta), MSF (blue) and HBG (red) and plotted against time, see Fig. 1:
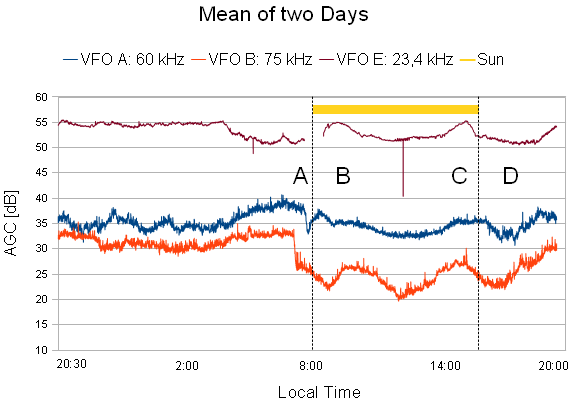
In Fig. 1 the yellow bar indicates the time span between sunrise und sunset. As can be seen, the change between day and night has a major effect on the received signal strength. According to Barin Kumar De, S.K. Sarka and Pinaki Pal (Characteristic Features of 40 kHz LF Signal Amplitude) a sunrise minimum (A), recovery effect (B), afternoon maximum (C) and sunset minimum (D) can be detected. The sunrise minimum (A) is observed before sunrise at the receiver location occurs. This is because the sunlight reaches the atmosphere in 70 - 90 km height earlier (and can build up the ionosperic D-Layer) than the surface of the earth beneath. Also the sunrise minimum of the signal of HBG takes place earlier than of the signal of MSF. This is due to the location of the both transmitter. HBG is situated about 9° eastward and 8° southward to MSF.
The diurnal variability in signal strength of the transmitters DCF77 (squares) and DCF39 (triangles) is different from the above results. The recorded signals of both days are plotted together against time, see Fig. 2:
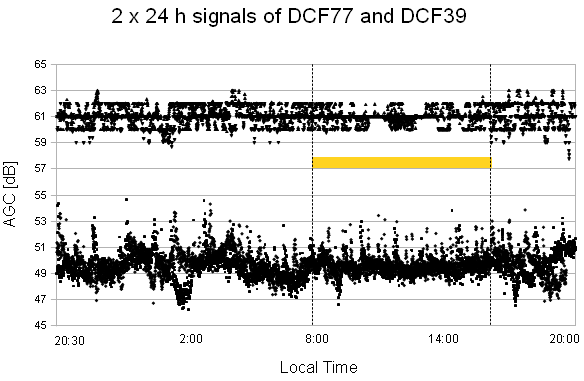
In Fig. 2 the yellow bar indicates the time span between sunrise and sunset. As can be seen, the DCF39-signal (upper scatter line) shows no significant dependence on time of day. This changes only a little with the DCF77-signal (lower scatter line). During nighttime the signal indicates a stronger variability than during daytime. There seems no interaction of the arriving transmitted signals with the ionosphere. So they must arrive as unaffected ground waves.
