Radio Monitoring
The significance of the sporadic E layer in the 20 m band
This study examines the contribution of the individual ionospheric layers to radio wave propagation in the 20 m band. In addition to the F2 layer, the sporadic E layer apparently plays an important role in the establishment of short-range connections, not only in summer but also in autumn and even winter. Based on Joe Taylor's WSPR beacon protocol, three measurement campaigns in the 20 m band in summer, autumn and winter will provide more detailed information on this.
In the 20 m band, the attenuation of radio waves as they pass through the D region no longer has a significant influence. The ionisation of the E layer (daily maximum ≤ 3.5 MHz during the measurement campaigns) only allows reflection at 14 MHz for very flat radio waves (< 15°). By choosing a TX antenna with a steeper radiation pattern, the E layer plays no role in radio wave propagation in this study. This leaves the F2 layer as the prominent reflection layer for radio distances down to the dead zone. What role does the sporadic E layer, Es, play here? The existence of the sporadic E layer itself is by no means sporadic but can be observed throughout the year. However, its degree of ionisation is unpredictable. It is known that the critical frequency, foEs, increases in the months of May to August, subject to strong daily and spatial fluctuations.
The distance between the TX station and a RX station determines the angle of incidence of the radio waves on the Es and F2 layers. The angle of incidence determines the diffraction in the ionospheric layer. The steeper the angle of incidence, the higher the degree of ionisation must be for successful reflection. The current electron density in both regions thus controls the distances within which radio contact can be established. The TX-RX distance is therefore a suitable measurement parameter for the state of the ionosphere. If the distances of all RX stations to the TX location are plotted as a function of time and a density map is created using a suitable statistical method, this map can be used to determine the state of the ionosphere at the respective point in time.
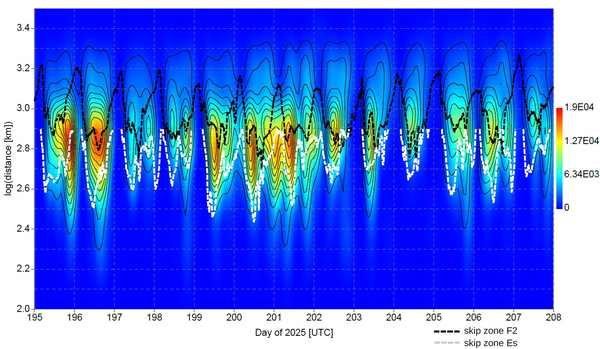
Fig. 1: Calculated density map based on the number of reception reports received per distance and time from RX stations within a radius of up to 2800 km around the WSPR TX station in summer 2025. The distances are shown in decimal logarithms. The daily courses of the skip zone of the F2 layer (black dotted line) and the Es layer (white dotted line) have been calculated from the respective critical frequencies measured by four European ionosondes.
Let us first look at the density map of the summer measurement, Fig. 1. It is immediately apparent that the dead zone of the F2 layer (black dotted line) is around 700 km during the day and is not sufficient on its own to explain the density distribution of the reports. Only when the course of the skip zone of the Es layer (white dotted line) is added does a much more coherent picture emerge. The course was only plotted up to a distance for which the antenna beam angle is still greater than 15°. Longer distances are no longer achieved in a single hop at the Es layer with the antenna setup used, but are then exclusively attributable to reflection at the F2 layer.
Due to the spatially variable ionisation density of the Es layer, even when using data from four ionosondes distributed throughout the reception area, complete agreement between the point measurements taken by the ionosondes and the comprehensive WSPR measurement cannot be expected.
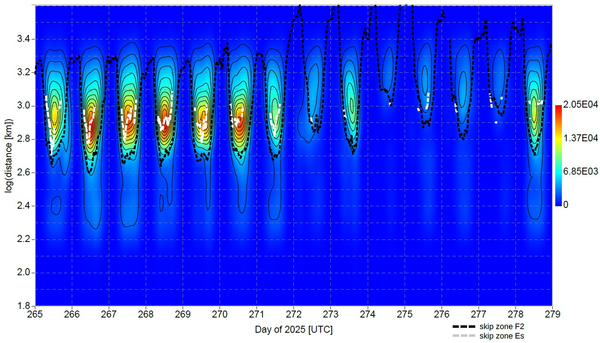
Fig. 2: Calculated density map based on the number of reception reports received from RX stations within a radius of up to 2800 km around the WSPR-TX station in autumn 2025, sorted by distance and time. The distances are shown in decimal logarithms. The daily variations of the skip zone of the F2 layer (black dotted line) and the Es layer (white dotted line) have been calculated from the critical frequencies measured by the Belgian ionosonde in Dourbes.
Fig. 2 shows the density map of the autumn measurement. Here, the high degree of correlation between the course of the skip zone of the F2 layer (black dotted line) and the density distribution of the reports is immediately apparent. In contrast to the summer, with its significantly lower average ionisation degree of the F2 layer, reflection at the F2 layer now dominates daily radio propagation down to TX-RX distances of 400 km. According to ionosonde measurements, the dead zone of the Es layer (white dotted line) is now significantly longer than that of the F2 layer. Nevertheless, WSPR contacts occur, albeit at a significantly lower density, down to a skip distance of 100 km on the ionospherically undisturbed days 265-271 and then again on 278. How can this be?
To this, the diurnal progression of the hourly number of reports for these short-range (100-400 km) contacts, summed over the whole measurement period, were analysed. It can be reproduced by adding three sine waves. These sinusoidal oscillations have periods of 23 hours, 11.5 hours and 7.7 hours. These correspond quite closely to the atmospheric tides and their subharmonics in the formation zone of the sporadic E layer (diurnal tide, semidiurnal tide, terdiurnal tide with period lengths of 24 hours, 12 hours and 8 hours). This leads to the conclusion that the short-range connections can be attributed to reflections at the sporadic E layer, even if the ionosonde measurements indicate otherwise.
Summarising, the measurements taken by the ionosondes at the F2 layer are in very good agreement with the results of the WSPR measurement campaigns. However, the recording of the ionisation density of the sporadic E layer by ionosondes did not always appear to be reliable. The sporadic E layer apparently enables short-range connections in the 20 m band during the day throughout the year, but especially in the summer months.
A more detailed description is published in this article published by CQ DL, the magazine of the DARC, 03/2026, pp. 44-46.
